Turning Data into
Meaningful Insights
I am a B.Tech graduate in Chemical Engineering who
transitioned into Data Analyticsthrough hands-on
projects and practical experience. I enjoy working with data to clean,
analyze, visualize, and identify patterns that can support better
decision-making.
My experience includes working with Python,
Pandas, SQL,
Power BI, and Excel.
Train
Schedule Analysis and Interactive Route Enquiry System
A Python and Pandas-based project developed during my Data Analyst Internship to clean and analyze railway train schedule data. The project includes station and route validation, train traffic analysis, schedule analysis, and an interactive source-to-destination route enquiry system with journey duration analysis.
data
professional
Survey dashboard
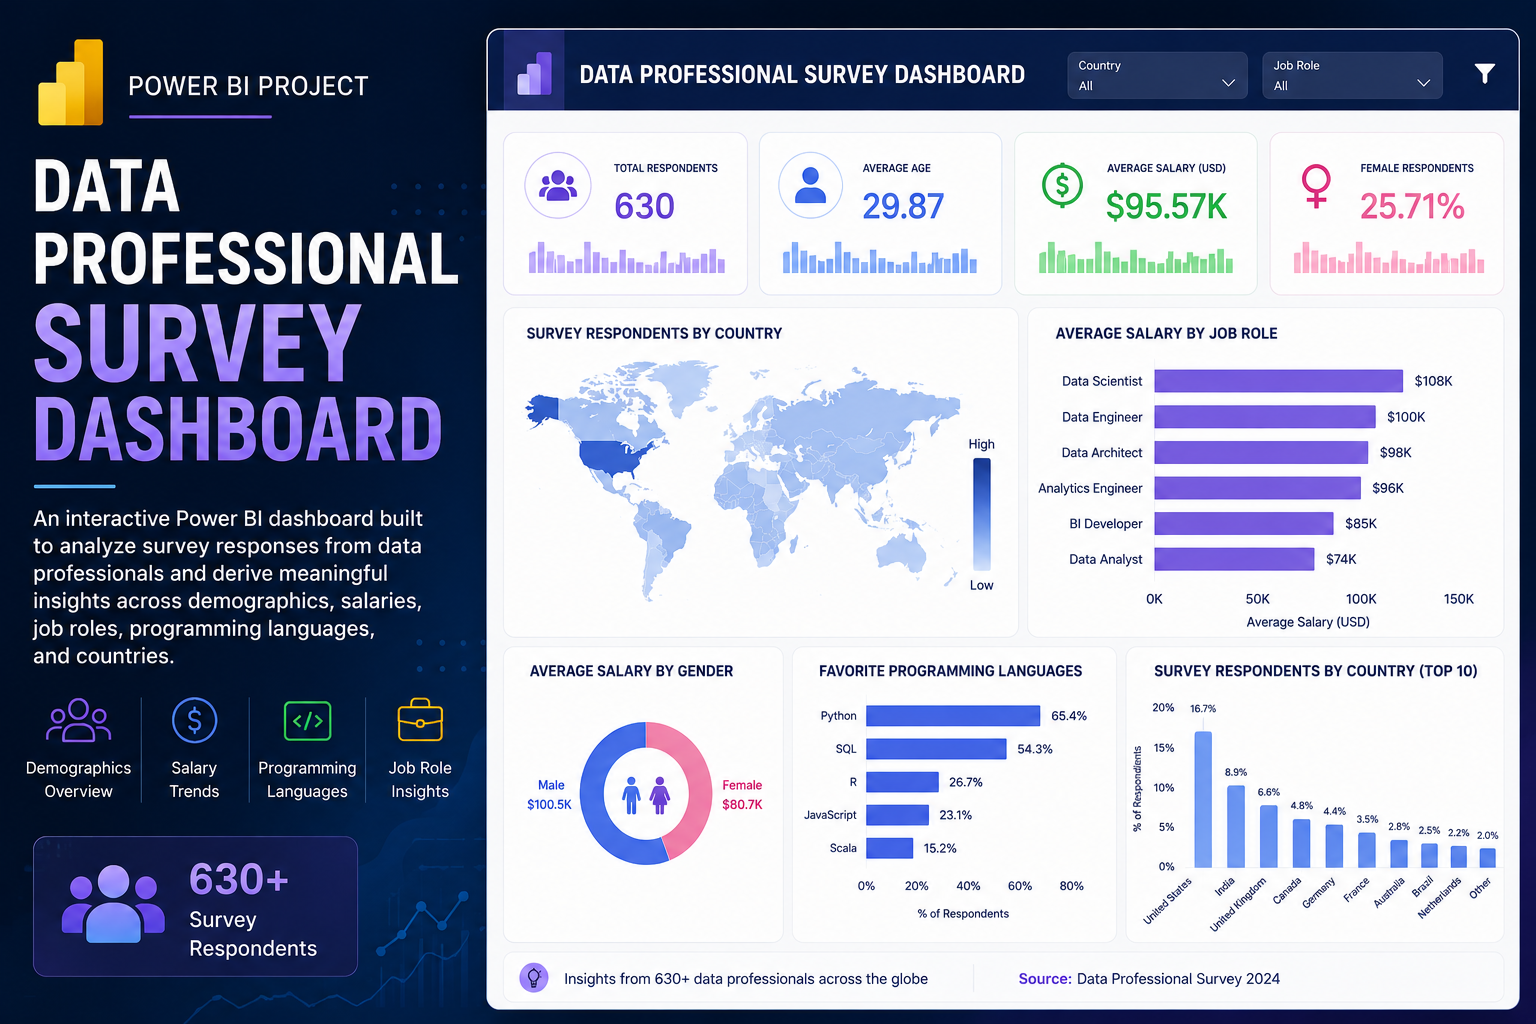
This project presents an interactive Power BI dashboard built to analyze survey responses from data professionals. The dashboard provides insights into demographics, salary trends, programming language preferences, and job roles through interactive visualizations.
Retail Sales & Profit Analytics
A Python and Pandas-based retail sales
analysis project focused on data cleaning, exploratory data analysis,
and visualization. The project analyzes sales and profit performance
across customer segments, regions, categories, products, and time periods
to identify key trends, revenue drivers, and profitability insights.
Tools: Python, Pandas, NumPy, Matplotlib, Seaborn, Jupyter Notebook